Mobility Impacts
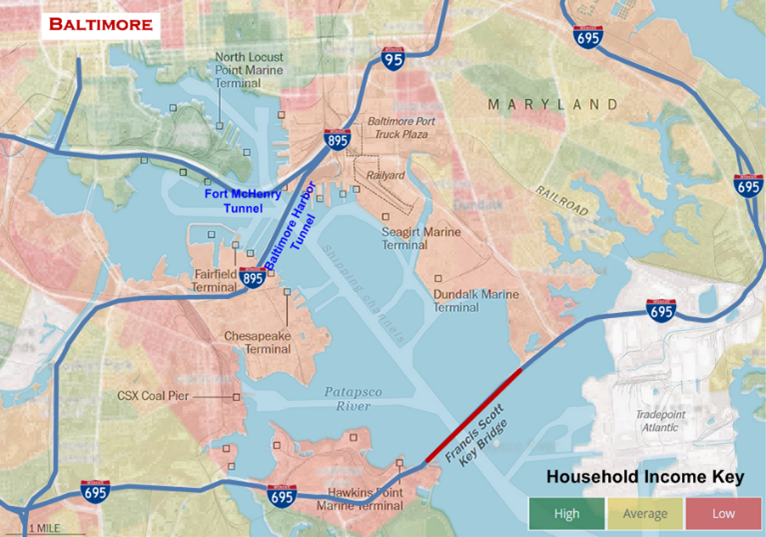
Using large-scale traffic data and more than 46,000 vehicle trajectories, this study evaluates how mobility patterns evolved one year after the collapse. Results show that while travelers and transportation agencies have adapted, major bottlenecks remain—especially along I-95 and I-895 near the tunnel crossings—indicating that the regional transportation system has improved but has not yet returned to pre-collapse conditions.
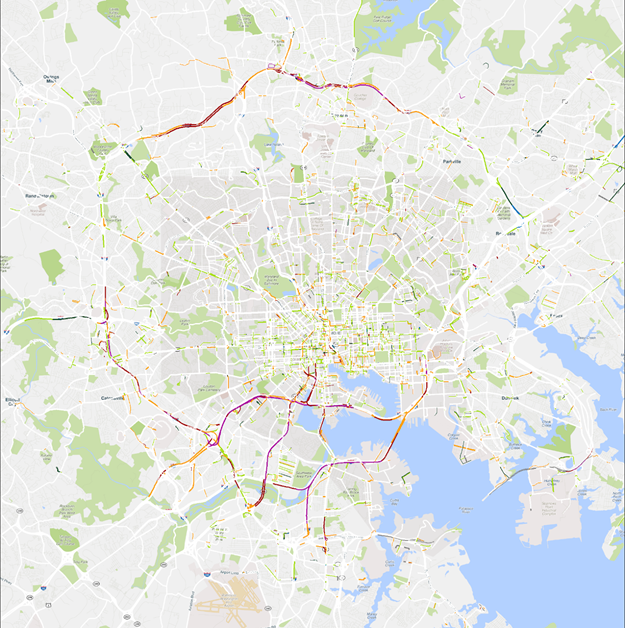
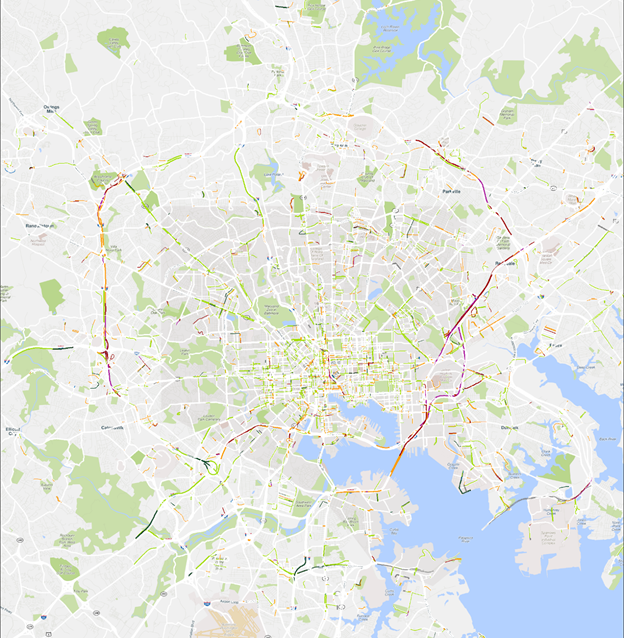
Mid-Term Change of TTI in Baltimore Area During AM Peak Mid-Term Change of TTI in Baltimore Area During PM Peak
Key Findings
- Persistent freeway congestion: Alternative routes through the Fort McHenry and Baltimore Harbor Tunnels continue to experience severe congestion. Even after one year, AM peak travel times through these bottlenecks remain approximately 50% higher than before the collapse.
- Morning congestion has partially recovered: AM peak delays have eased as commuters adapted through schedule changes, telework, and route adjustments. However, tunnel approaches remain significant bottlenecks.
- Evening congestion remains a major challenge: PM peak congestion has shown little recovery, with persistent delays caused by commuter demand, discretionary trips, and freight traffic shifting into later periods.
- Local adaptation reduced some impacts: Improvements were observed on portions of I-695 where bridge-related traffic demand decreased, demonstrating how travel behavior changes can reshape network conditions after a major disruption.
- Short trips were affected the most: Short commuter trips through the tunnel bottlenecks experienced the largest delays. PM peak short trips nearly doubled in duration and remained about 87% longer than pre-collapse levels one year later.
Safety Impacts
The bridge collapse and the resulting re-assignment of traffic would raise both short-term and long-term challenges to traffic safety, both corridor-wide and region-wide. Specifically,
- Increased saturation level at tunnels: As primary detour routes for the collapsed bridge, Baltimore Harbor Tunnel on I-895 and Fort Mchenry Tunnel on I-95, were experiencing near-saturation traffic conditions during peak hours and now face a substantial volume increase (20% - 30%). This over-saturation leads to heightened traffic turbulence and aggressive driving behaviors, increasing the risk of accidents and bringing more challenges to incident responses.
- Increased traffic volume on local city roads: The overflow from tunnels has redirected a substantial volume of traffic to local surface roads, creating new bottlenecks at intersections and signalized corridors. These drivers, unfamiliar with the area’s complex urban layout, lead to potential safety risks, particularly for vulnerable road users (VRUs), which aggravates the pedestrian safety concerns in Baltimore City.
- Increased truck volume on local city roads: Height and hazard material restrictions in tunnel use force trucks, previously routed over the Key Bridge, onto local roads. Such a shift not only raises the severity of potential accidents due to larger vehicle sizes but also obstructs sights of all road users, increasing risks to pedestrians and cyclists.
Working closely with the Baltimore City Department of Transportation, the MTI team has conducted data collection of crash records, infrastructure data, mobility patterns, etc. in the Baltimore area:
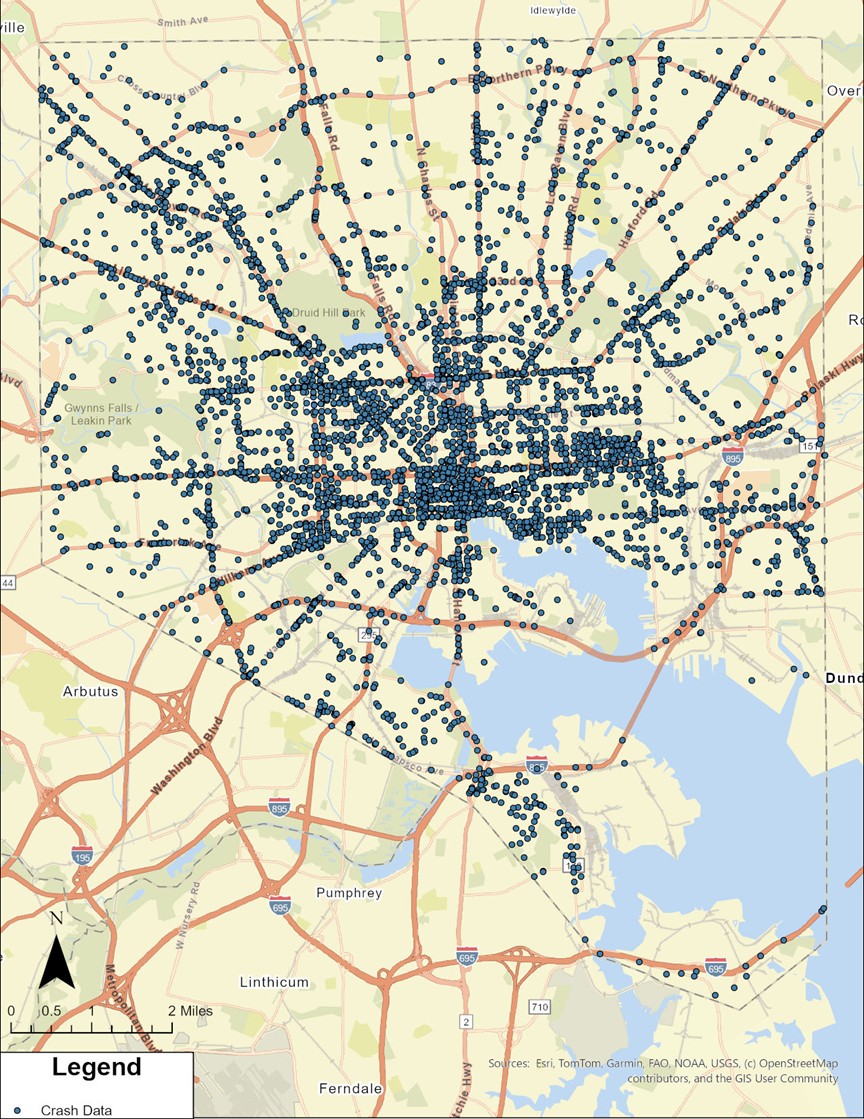
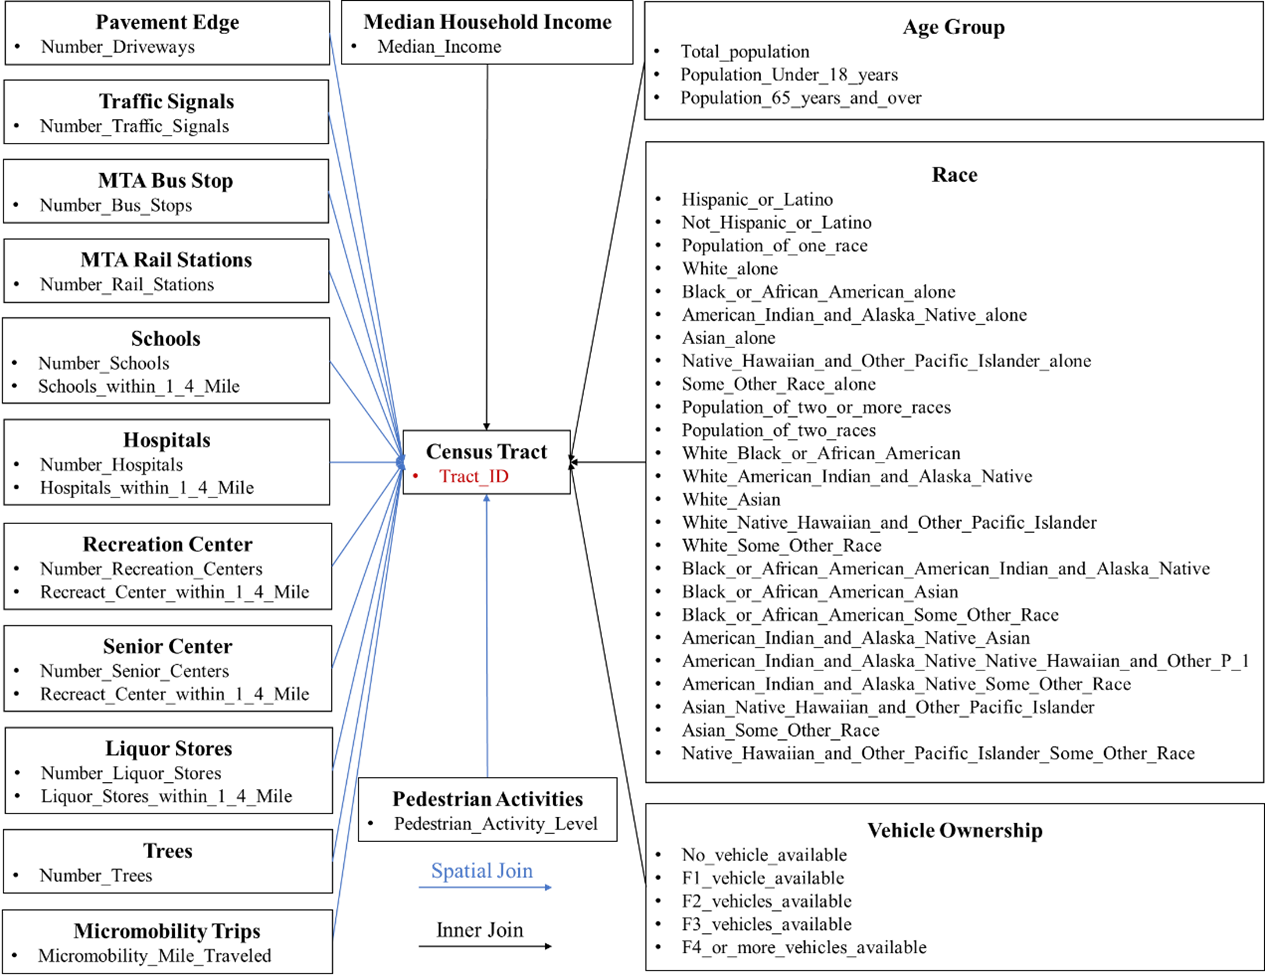
Processed Crash Dataset Datasets Used to Generate Census-Tract-Level Data
The MTI team has also developed two High Injury Networks. The first set comprises segments with a high occurrence of crashes involving non-motorists. The threshold is an average annual crash frequency of at least 1, yielding about 700 segments. The second set comprises segments with a high occurrence of crashes resulting in fatalities and severe injuries. The threshold is a total of at least 2 fatalities or severe injuries over five years (equivalent to an average annual count of 0.4), yielding about 1,000 segments.
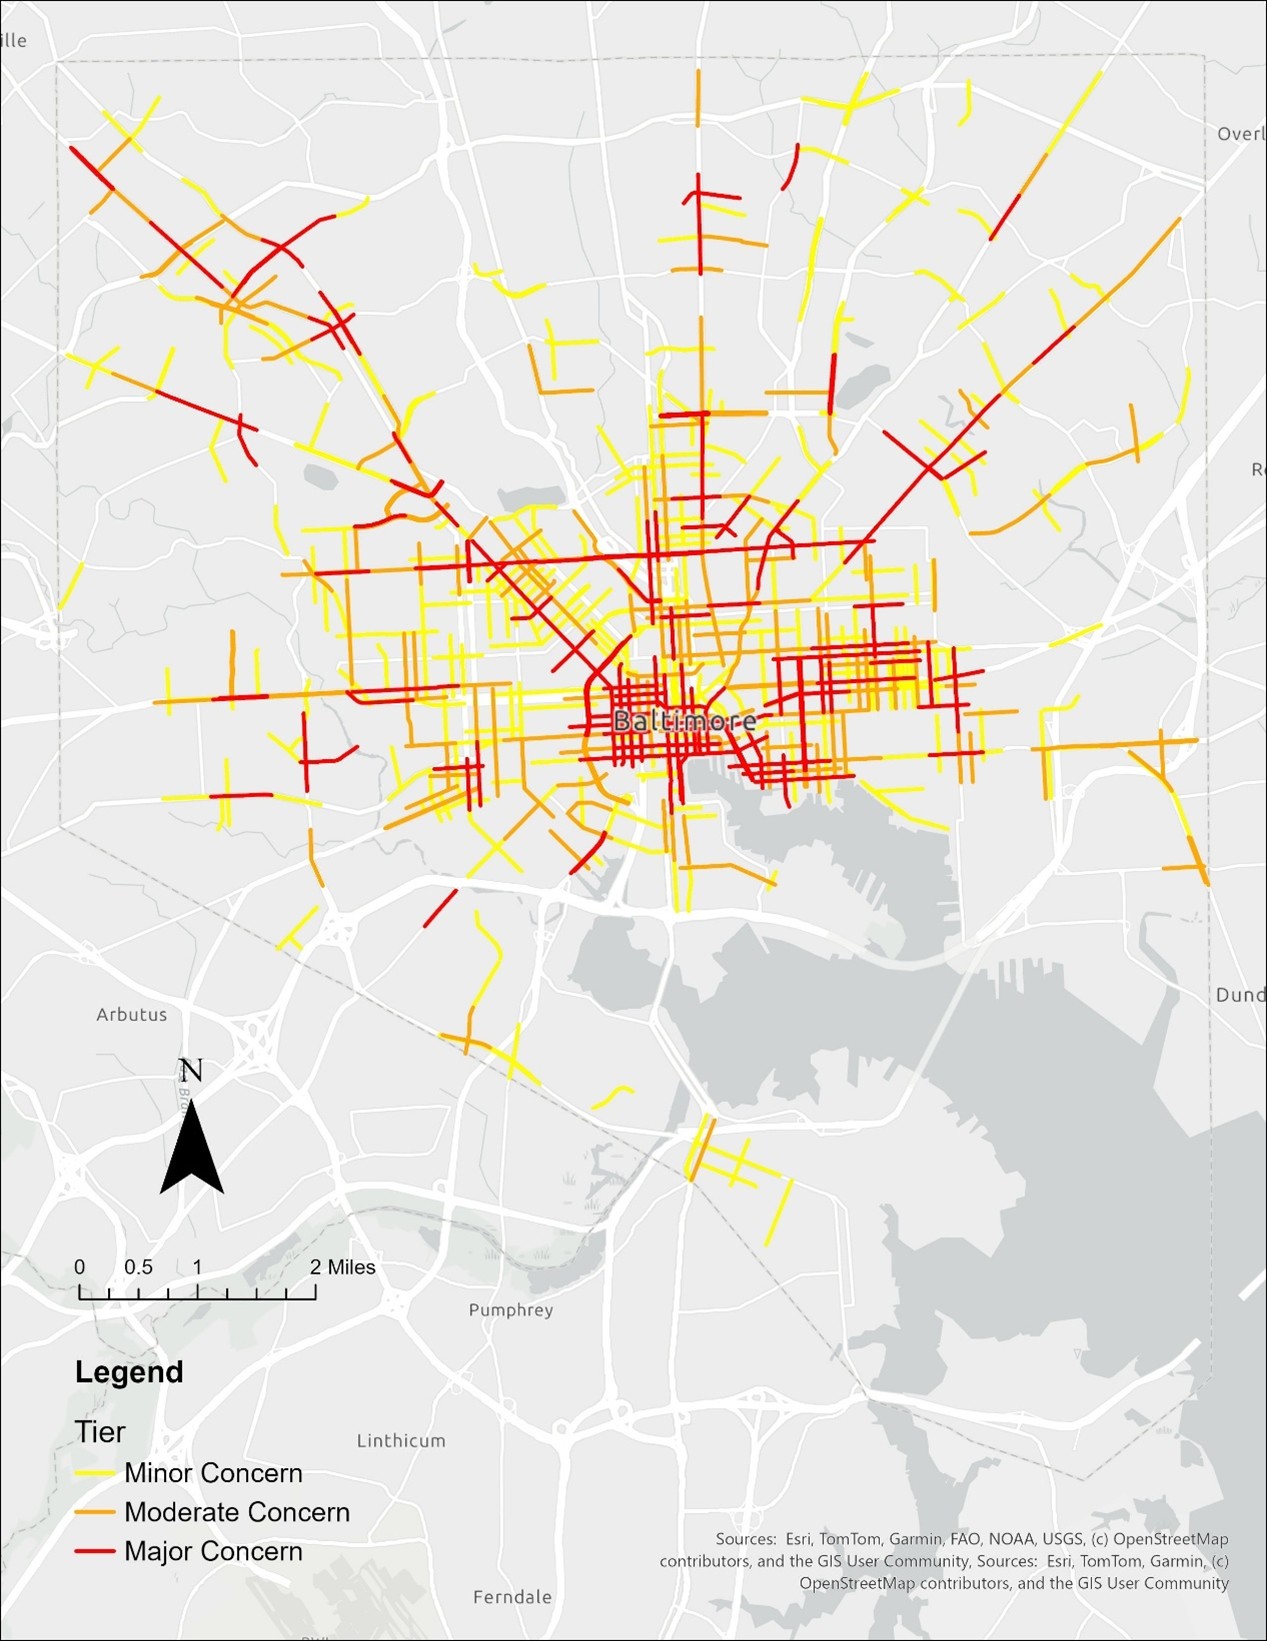
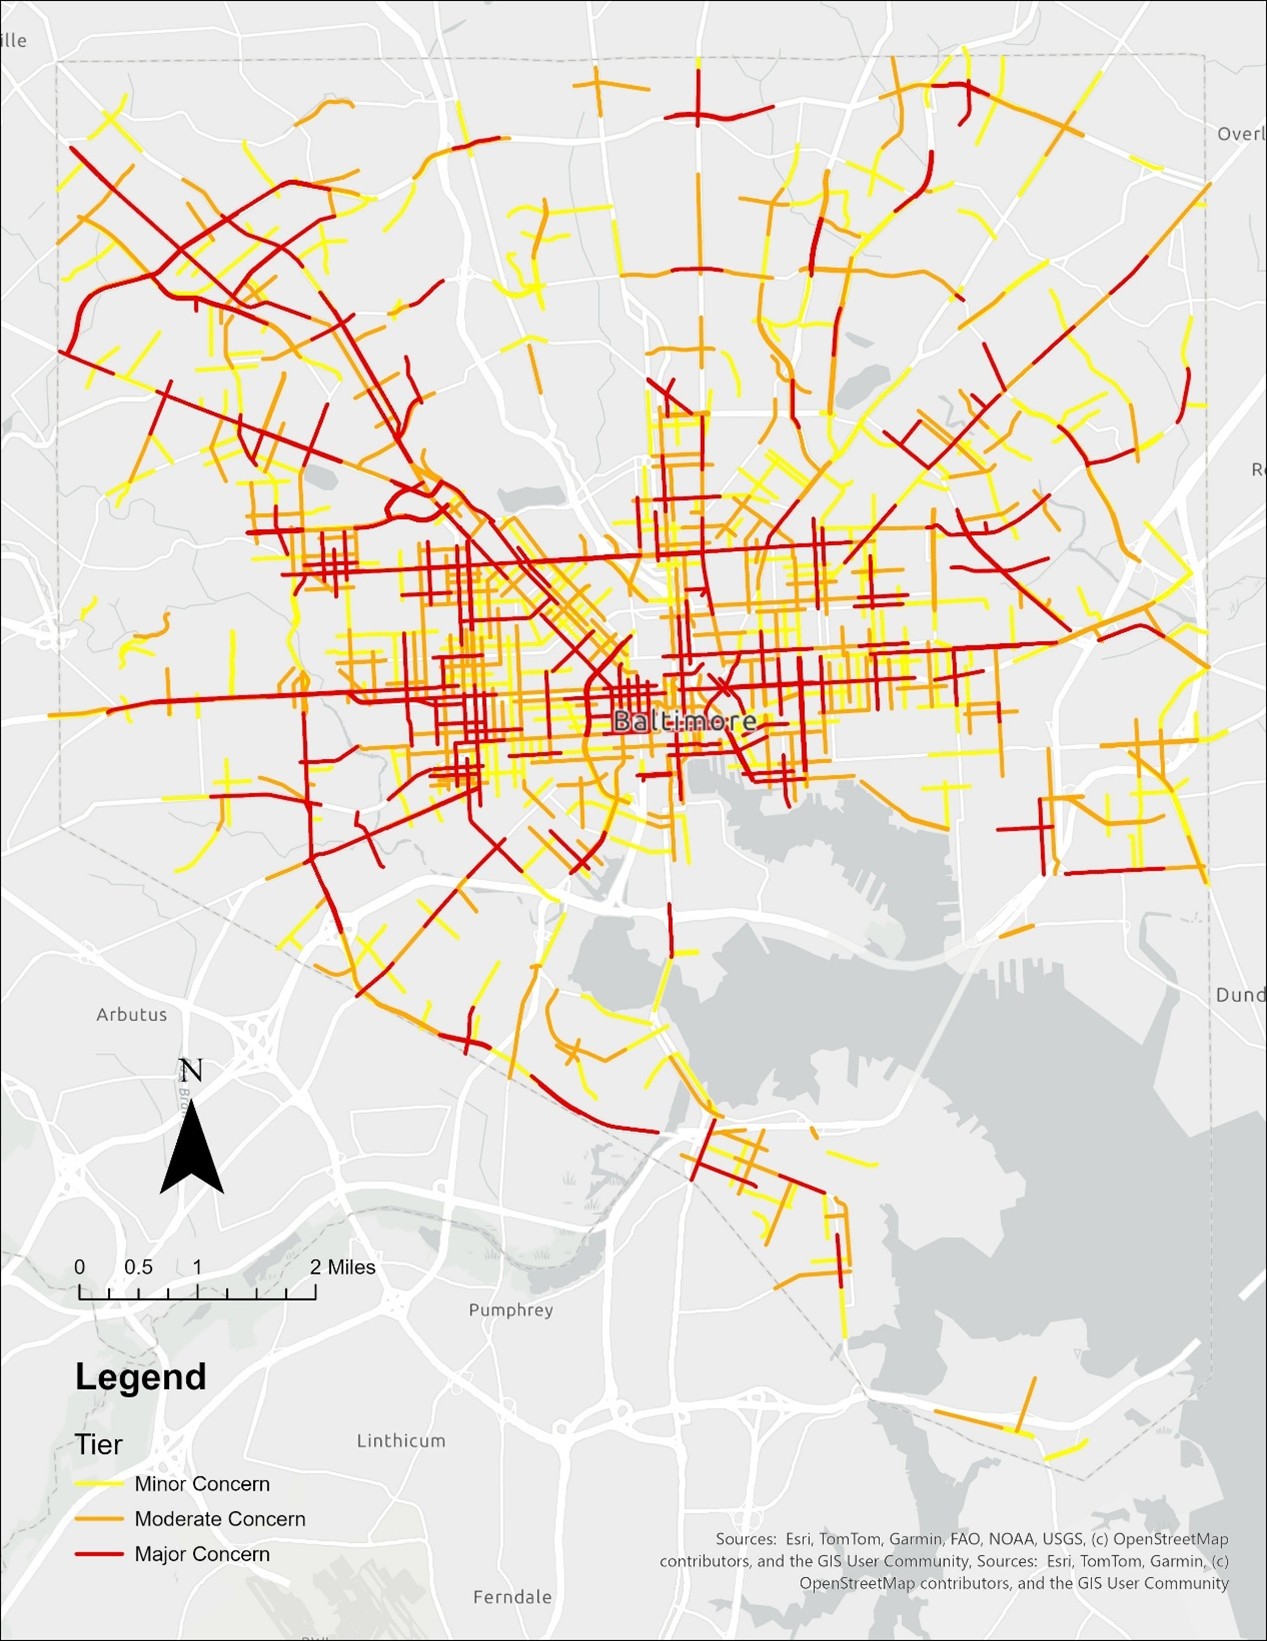
High Injury Segments with Concerns Related to Non-Motorist Crashes High Injury Segments with Concerns of Fatalities and Severe Injuries
Mitigation Strategies with Smart Traffic Signal Control Systems
By working with BCDOT, the project addresses the following main technology areas with the objective of mitigating the mobility impacts to Baltimore City caused by the Key Bridge collapse:
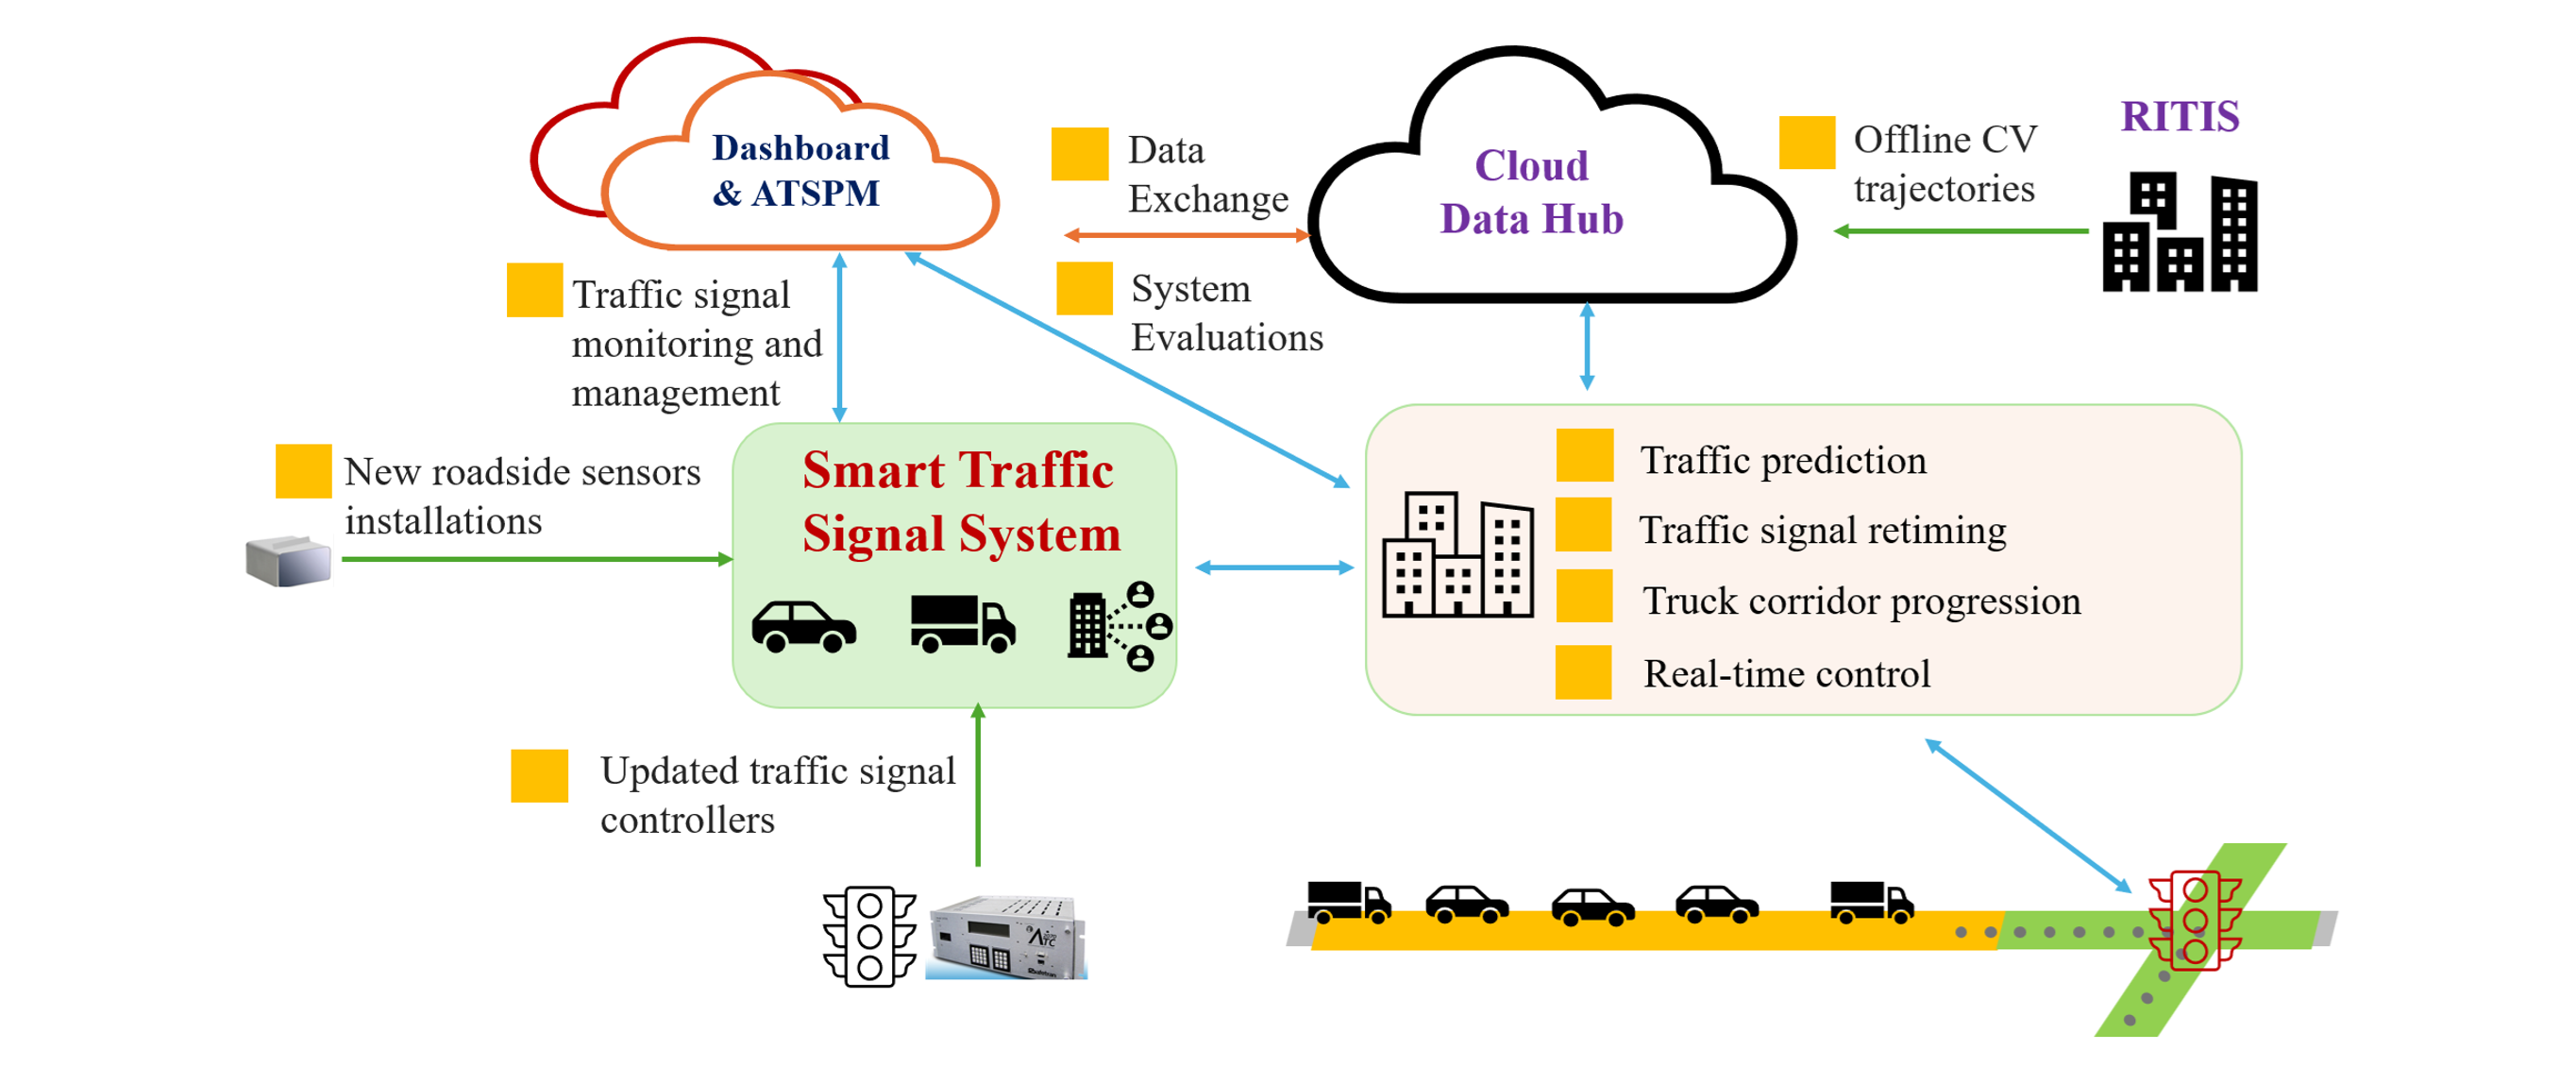
- Smart Technology Traffic Signals: This project upgrades traffic signals in 50 intersections on the detour corridors, including replacement of signal controllers that cannot integrate with adaptive and smart systems, adding signal communication, and creating a quick, customized dashboard to remotely monitor and manage traffic signal operation. Also, an automated traffic signal performance measures (ATSPM) dashboard is developed to actively manage traffic signals and monitor intersection performance.
- Intelligent, Sensor-Based Infrastructure: This project enhances the city’s transportation infrastructure by installing 8 new CCTV cameras and 25 traffic detection radar sensors. The CCTV cameras are strategically placed at boundary intersections of selected corridors to classify vehicle types and determine truck percentages in the traffic flow. The traffic detection radar sensors are deployed at 25 key intersections to support the development of ATSPM and enable real-time actuated traffic control.
- System Integration: This project links signal controllers and sensors with a "cloud data hub." This hub fuses real-time traffic data with offline CV data, providing a dynamic understanding of mobility patterns. This integration also enables active traffic signal management by optimizing signal timings and the ATSPM dashboard.
As shown in the figure below, the system integrates real-time traffic data from installed roadside sensors and offline vehicle trajectories from sources like INRIX connected vehicles, forming a cloud data hub. This comprehensive data integration will enhance our understanding of mobility patterns and allow for the optimization of traffic signal timing, improving road safety for all users, including pedestrians, cyclists, and vehicles. Additionally, ATSPM will be developed to enable efficient traffic management.
Projects and Sponsors:
- Multifaceted Data Collection on the Aftermath of the March 26, 2024 Francis Scott Key Bridge Collapse in the DC-Maryland-Virginia Area. National Science Foundation.
- The Baltimore City SS4A Action Plan: Study the Impacts caused by the Key Bridge Collapse in Baltimore. Federal Highway Administration.
- Assessing the Aftermath: An In-Depth Analysis of the Regional Impact of the Francis Scott Key Bridge Collapse. US Department of Transportation SMARTER Regional Transportation Center.
- Smart Traffic Signal Systems to Mitigate Bridge Collapse Impact in Baltimore City. Federal Highway Administration & Baltimore City Department of Transportation.